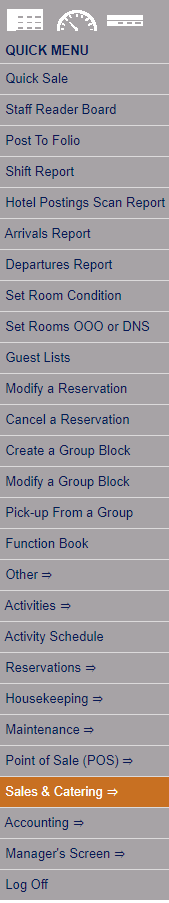
The Sales and Catering Menu may be reached either directly from the Quick Menu, or by using the Full Menu and selecting Sales and Catering => from the Other section.
1. Select Sales and Catering => from the Quick Menu (left side of screen).
OR
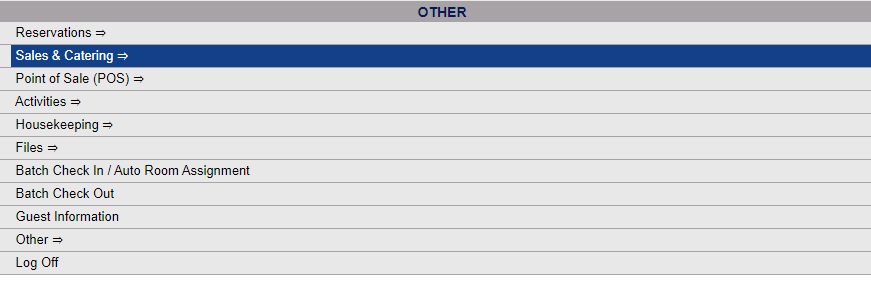
2. Select Sales and Catering => from the Other section of the Full Menu,
Click the icon on the left for the Full menu.

This will display the Full menu in a tabular form, with four sections, Registration, Status, Cashier and Other.

Select Sales and Catering => from the Other section.
This will display the Sales and Catering menu in a tabular form, with four sections, Selling Tools, Groups, Sales Reports and Catering Reports.

The Conference Sales Projection command is in the Catering Reports section.

When the Conference Sales Projection command is selected, the Conference Sales Projection screen will open.

Select a Start Date/Period/Year for the report. This identifies the month and year from which you want to begin reporting.
By default the by Date option is selected, with the Report Date field showing. Use the drop-down menus or the calendar icons to select the date you wish to have displayed on the report . By default the date selected is today's date. This will mean the report shows the groups with Conference events scheduled at your Property occurring today.
Selecting the by Month(s) option instead will refresh the screen, and allowing the report options to be selected that allow the report to be generated for more than one date.

Period: The selection of the Period (month of the year) to begin the report in rather than one specified date. This is a drop-down menu from 1-12 (corresponding to the 12 months in a year). By default the period selected corresponds to the current month.
Year: Select the year to begin the reporting from the drop-down menu. By default the current year is selected.
Months: How many months of data to display on the report. This is a drop-down menu from 1-12, allowing the report to be generated for a time period from one month to one year. By default 1 is selected. You can select to report on up to 12 months (one year).
Show Summary by Month: This box may be checked or unchecked. By default it is unchecked. If checked, the report information will display ONLY monthly totals, not listing the separate events within the specified month.
When finished, click the orange button Print Report
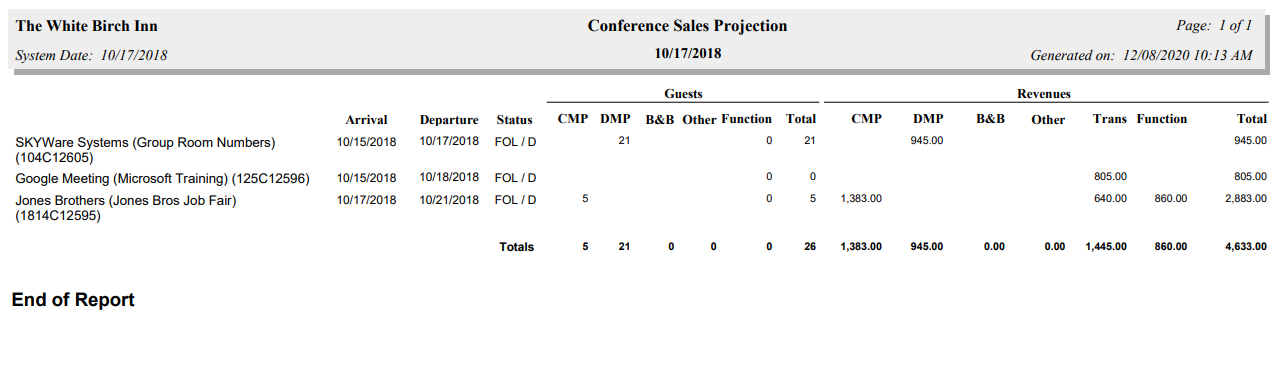
Once generated, the report shows the name and confirmation number of the group associated with the conference, the arrival and departure dates, the status of the group, and any packages associated with the group broken down by both guest numbers and revenue, both listing entries for separate package types (CMP, DMP, B and B, Other or Function, with a Total for all combined for each group) with their totals, so that it can be seen how many guests were associated with each, and how much revenue this generated for your Property. This version of the report shows groups with Conference events scheduled at your Property occurring on the specified day ONLY.

Once generated, as in the by Date version, the report will show the breakdown for all of the groups, the number of package transactions per group and the total revenues, however it now also separates the groups by month and displays the monthly guest and revenue totals.
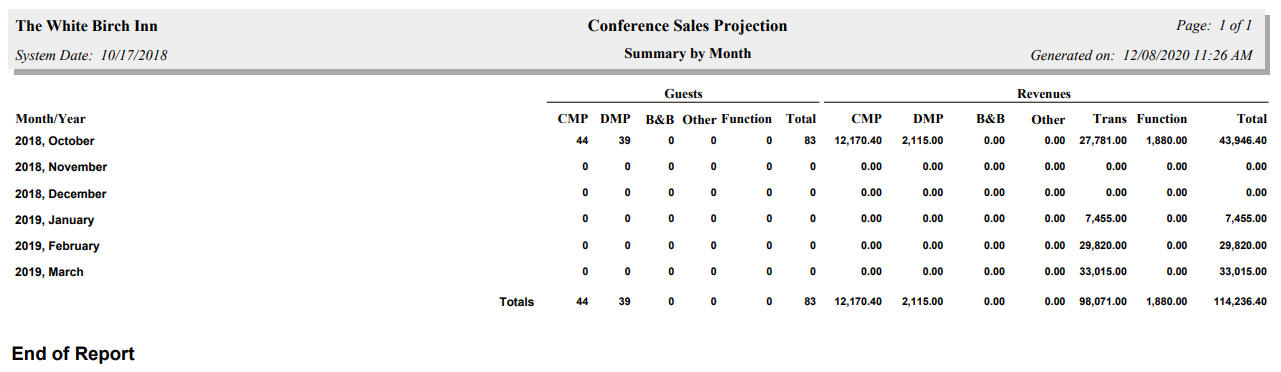
In this version of the report, Only the TOTAL values for the selected months are shown, NOT the breakdown showing both the individual group conference events within the month and the totals.
By default, the report is generated in PDF form and opens in a separate browser window. From there you can select to save or print the report, among other options. You can, instead, check the Generate report to Excel checkbox to generate the report to view or print as an Excel file instead of PDF. The information in this case will then be correct for importing into another document rather than immediate viewing.
NOTE: The generated report appears as a pop-up window through your browser. If your browser is set to block pop-ups, you may receive a warning banner at the top of the browser. Click this banner and select to allow pop-ups so that you can view the report.